Research
Hypoxia Forecast Model Development and Application
Delivery of synthesized and retrospective model results to stakeholders and the HTF is a key product of this focal area. Support for the operation of 3-D time variable models has been used to demonstrate the seasonal dynamics of gulf hypoxia and what factors contributed to the observed hypoxic zone during the annual cruise. These models explicitly include biological, atmospheric, and oceanographic forces including wind, currents, stratification, waves, temperature, and primary productivity, among others. They allow us to make predictions in the future of how different variables are likely to influence the hypoxic zone and consider not just area but also volume, and duration. These can be used to hind cast the zone with known weather, oceanographic and nutrient conditions to get spatial recreations of the zone through the entire year. This information has been delivered annually at the HTF meeting since 2016, an especially important contribution, as the cruise did not occur in 2016. See Products for more information.This group of models, the 3-D time variable models, are coming to a maturity and beginning to be utilized. This is in part due to a white paper titled, "Modeling Approaches for Scenario Forecasts of Gulf of Mexico Hypoxia," which was developed by a Modeling Technical Review Panel at the 3rd annual workshop (2012) describing the state of deterministic models. Since then, two biogeochemical models run with hydrodynamic models, one with FVCOM and the other ROMS, have been further developed to characterize the dynamics of hypoxia from spring through summer. Below are videos of the two models for 2018. This shows the 3D time variable model simulations of hypoxic zone areal extent from May through August, date is on the upper left of the video. This is 3D, hypoxia will appear on the bottom. The two vertical panels offer a cross section of the entire water column. The surface image depicts salinity. Red indicates hypoxia. This year the model confirmed suspicions that strong winds led to upwelling and mixing of the water column, reducing the zone size below what would have been expected due to the level of nutrient loading.
ROMS
FVCOM
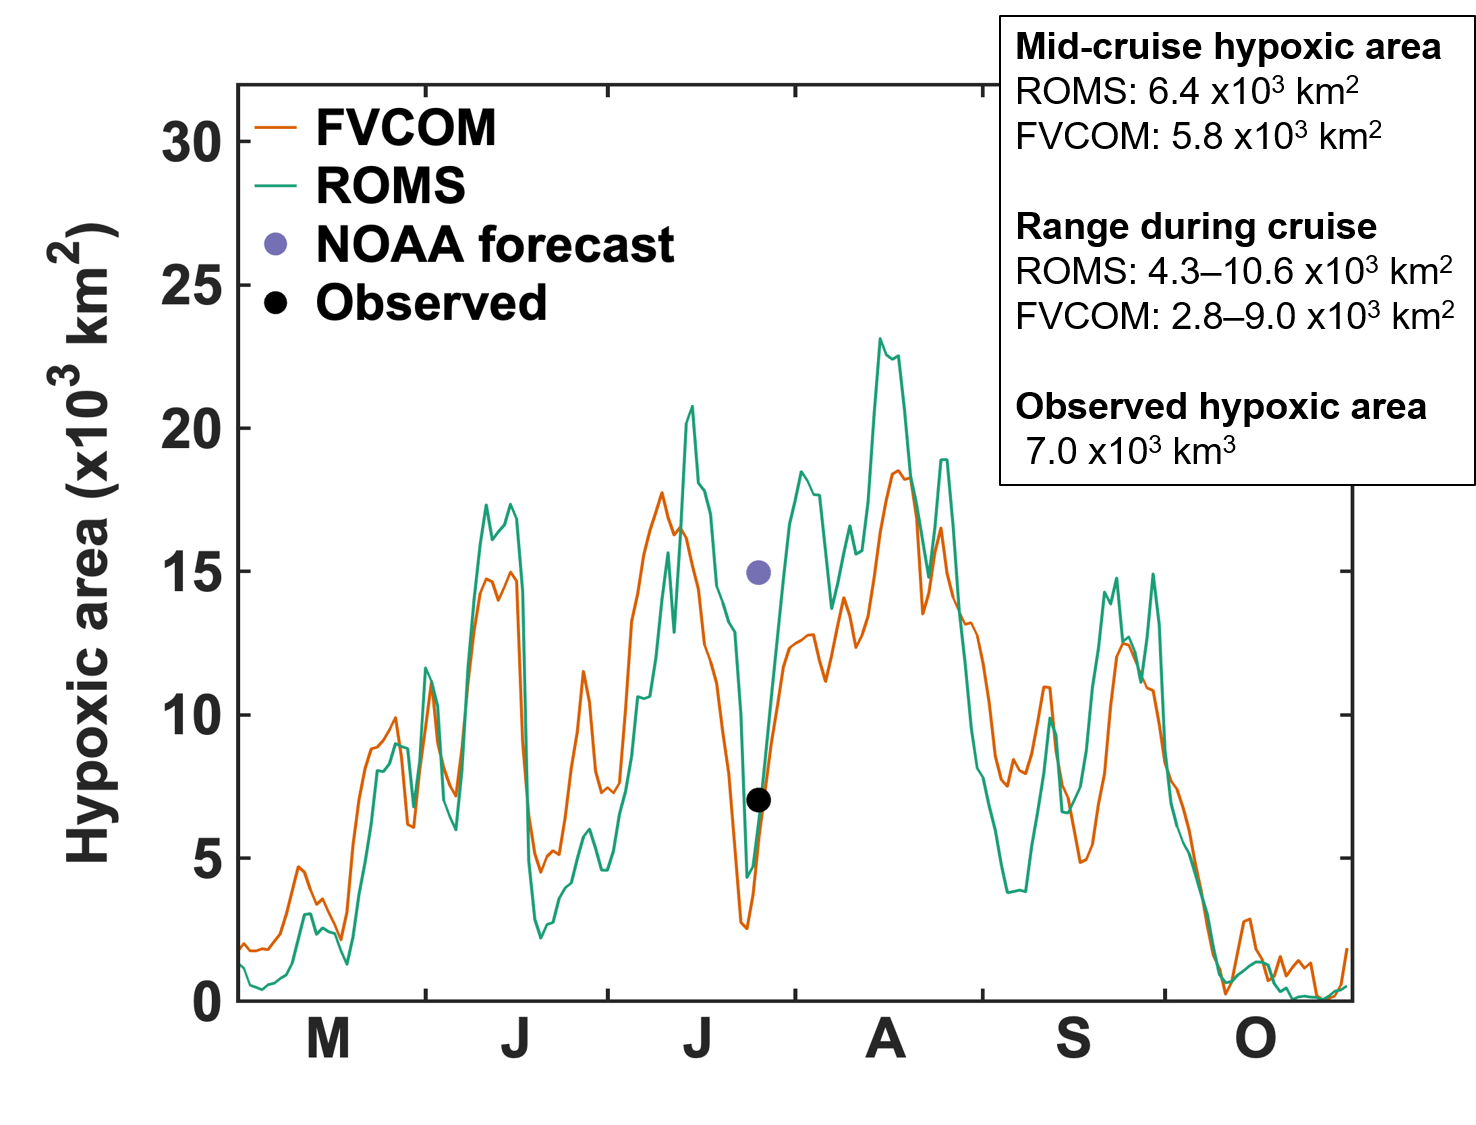
It is clear in the videos that the zone really grows in mid-May, and then grows until late June (June 20). After a period of high wind and mixing, the zone recovers and again in Late July, yet at the time of the cruise it shrinks again due to strong winds and upwelling. The two key wind events, one at the end of June, and then one at the end of July when the cruise was carried out this year.
Also, note that the models differ in the timing of their predictions, though in each case the measurement (black dot) was very close to these two models. The reformation of the hypoxic zone following a disturbance form mixing is a difficult period to model and the models often differ most during this period.


